

AuPest Tutorial
( Best viewed with a resolution of 1024 x 768 )
In the following pages, a stepwise introduction is presented of how to work with AuPest after the automated AuPest processing has been carried out immediately after the GC/MS run.
This is the phase where the analyst looks over the results produced by the program by checking the proposed pesticide residues in the sample. All opinions or final decisions are copied to the summary list together with comments.
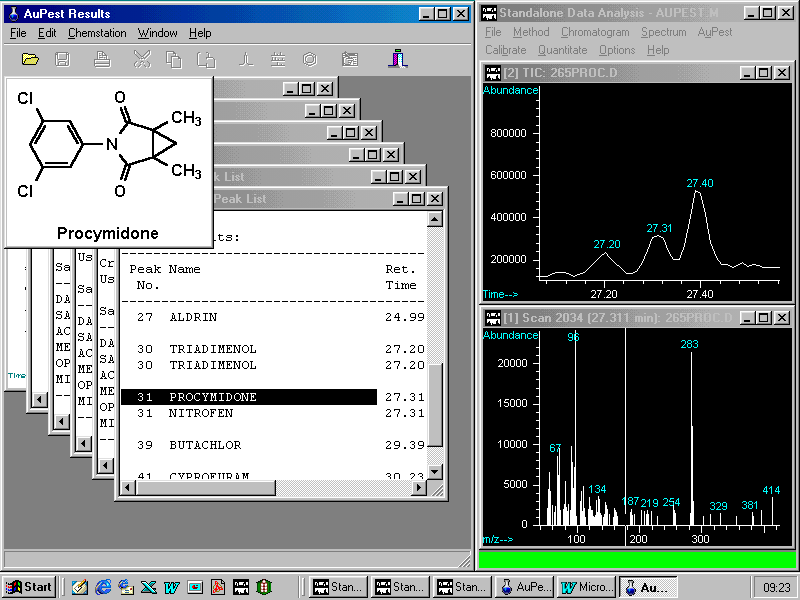
On opening, Standalone Data Analysis Menu appears with the integrated AuPest pull down menu in the Menu Bar
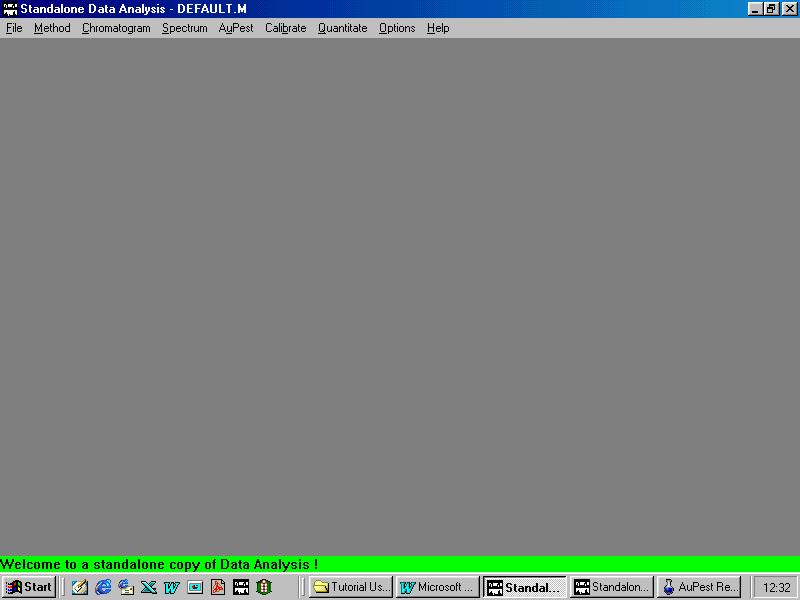
Loading a data file for the Standalone Data Analysis as usual with the HP ChemStation software
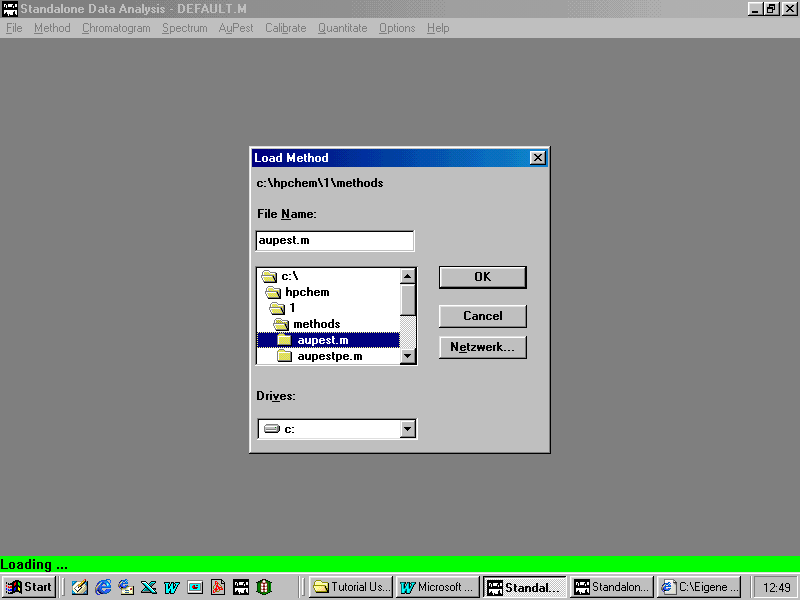
It is highly recommended to start with loading the method aupest.m
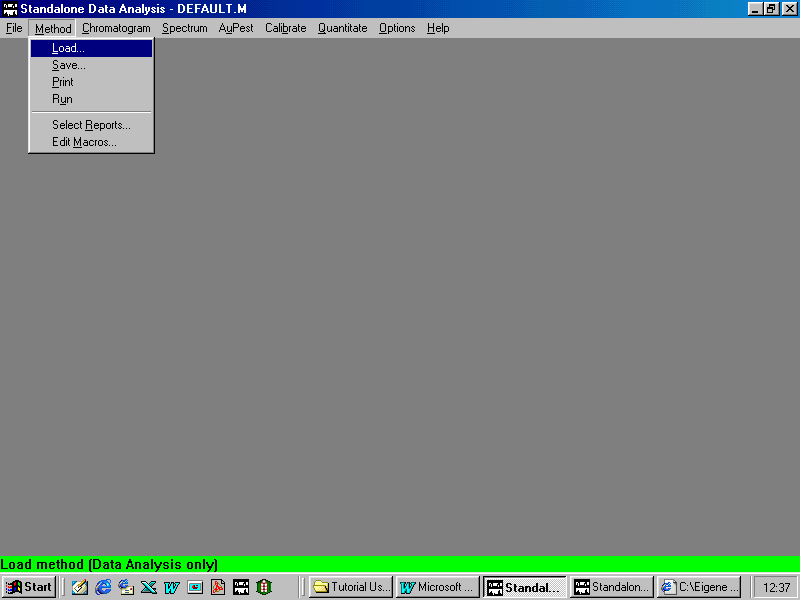
aupest.m is loaded fromc:\hpchem\1\methods
Loading a data file from Standalone Data Analysis Menu
Selecting a data file from "HPCHEM\1\DATA" where the processed data are stored
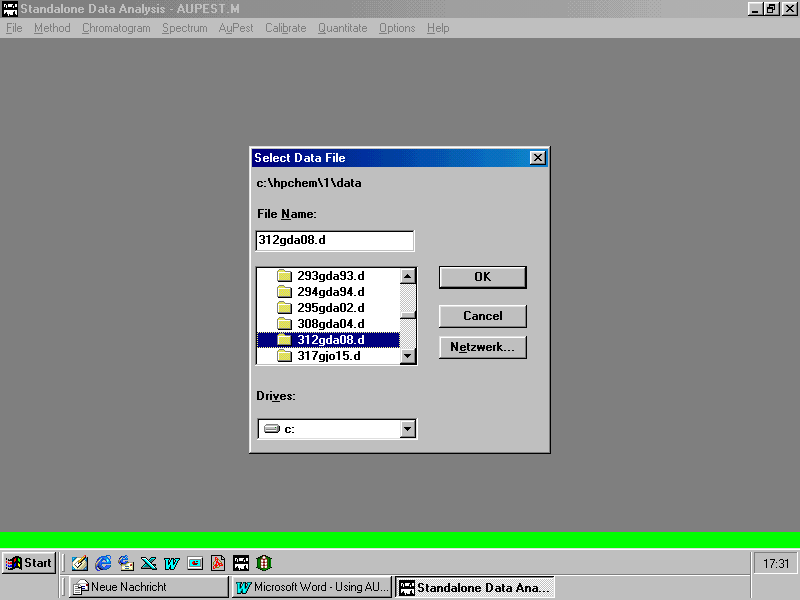
A data file loaded with Standalone Data Analysis Menu
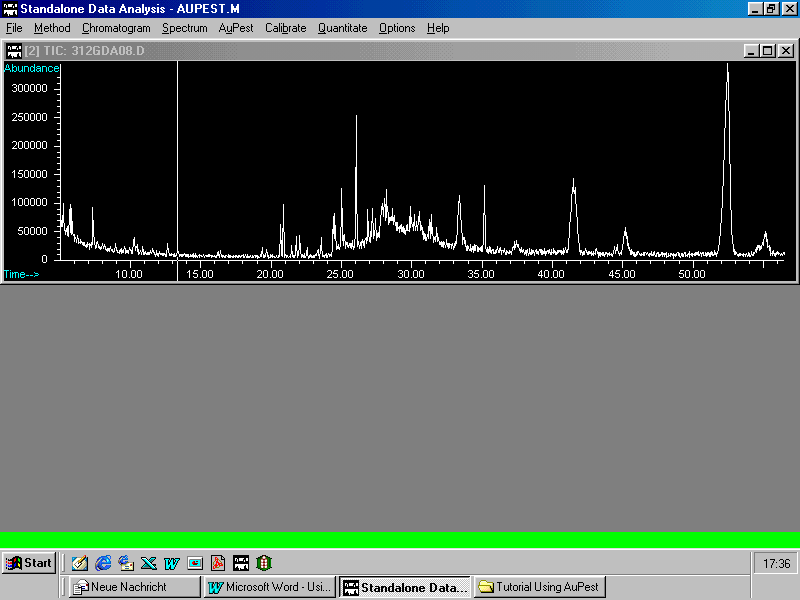
Note: All these data have already been processed with AuPest Level 1 and Level 2 according to the parameters set by the analyst!
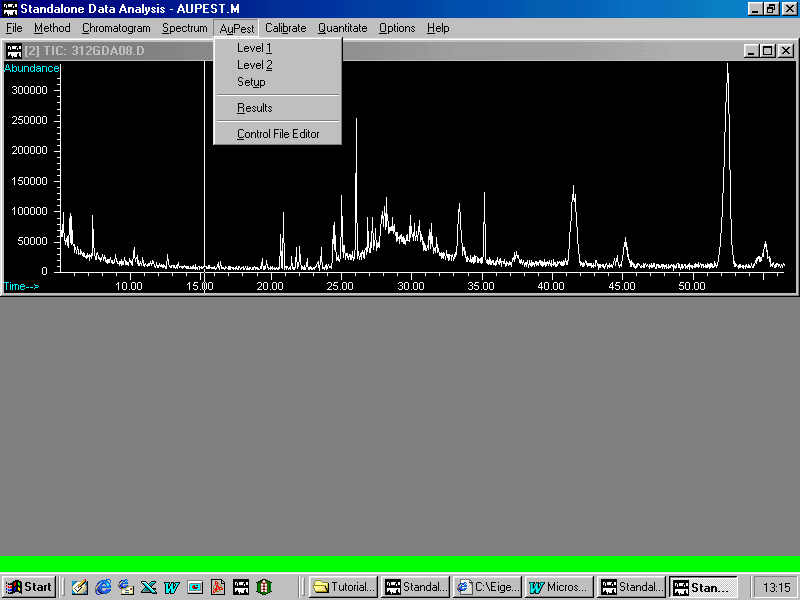
From the AuPest pull down menu Results may be selected
On selecting Results the following display appears on the monitor
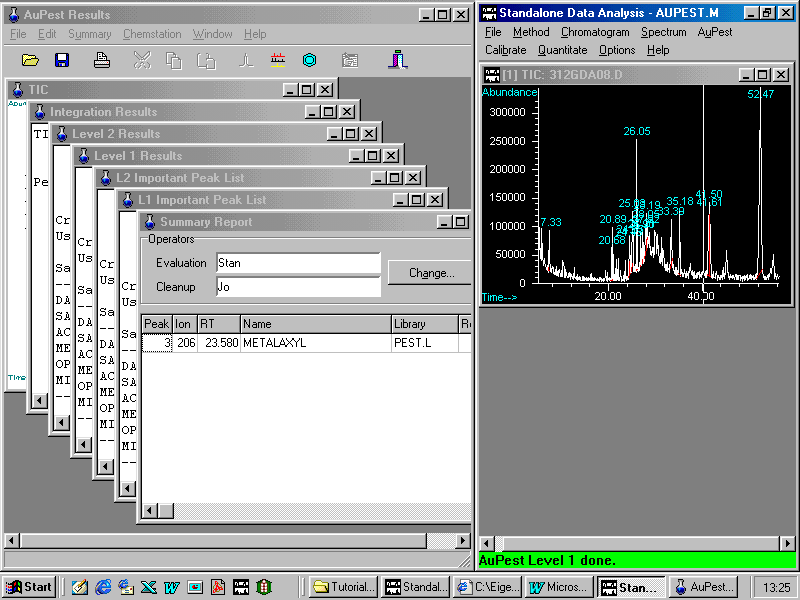
In the right window, Standalone Data Analysis from HP ChemStation is active with all features. In the left window AuPest Results is active.
AuPest Results are presented on a number of pages containing the TIC chromatogram for presentation purpose and all the integration results of all peaks in the TIC chromatogram. These more traditional data are of minor importance.
Level 1 Results contains all peaks that have been found to match better than a selected quality threshold with a mass spectrum in the pesticide library PEST.L which is used in AuPest processing.
The L1 Important Peak List is created from these results by selecting only those pesticides which appear at the expected retention times. From this list, all pesticides exhibiting retention times that do not fit within a time window are excluded but pesticides with only low match quality are included, if the fit with their calibrated retention time is good. These pesticides should be checked by the analyst in order to make a final decision, as shown later.
Level 2 Results contain all pesticides that have been found with the special search algorithm using ion chromatograms in time windows.
Again, in the L2 Important Peak List, only those pesticides are reported which appear at the expected retention times.
AuPest supports the analyst by zooming in the TIC chromatogram (Level1) or ion chromatograms (Level2) just by clicking with the mouse button on the pesticide to be checked, as shown later.
Usually checking of the results starts with the L1 Important Peak List.
One way to select one of the six automatically created result pages is the pull down menu Window. The default appearance of AuPest Results is the arrangement as cascade, other arrangements are possible. There are other options to open one of the result pages such as clicking in the window caption.
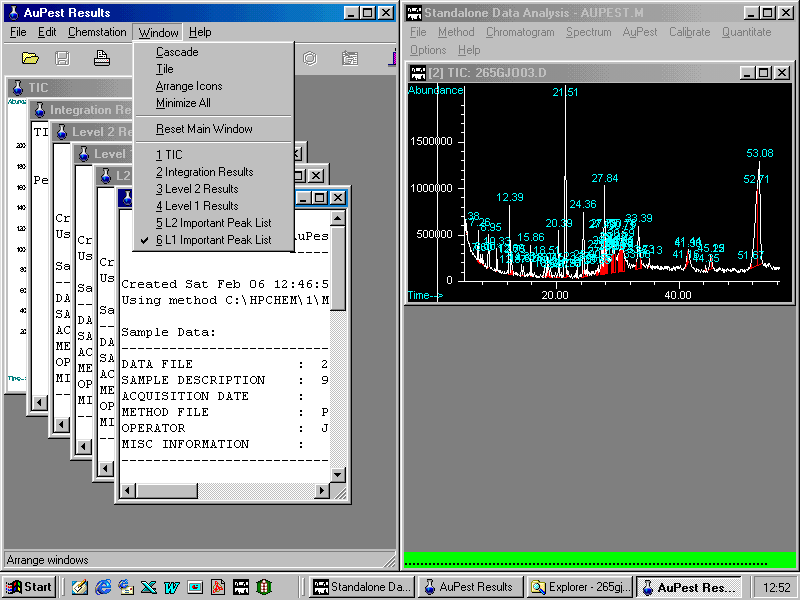
The AuPest Results window shows here the arrangement as cascade with L2 Important Peak List in the foreground. By mouse click another page in the pull down menu will appear in the foreground.
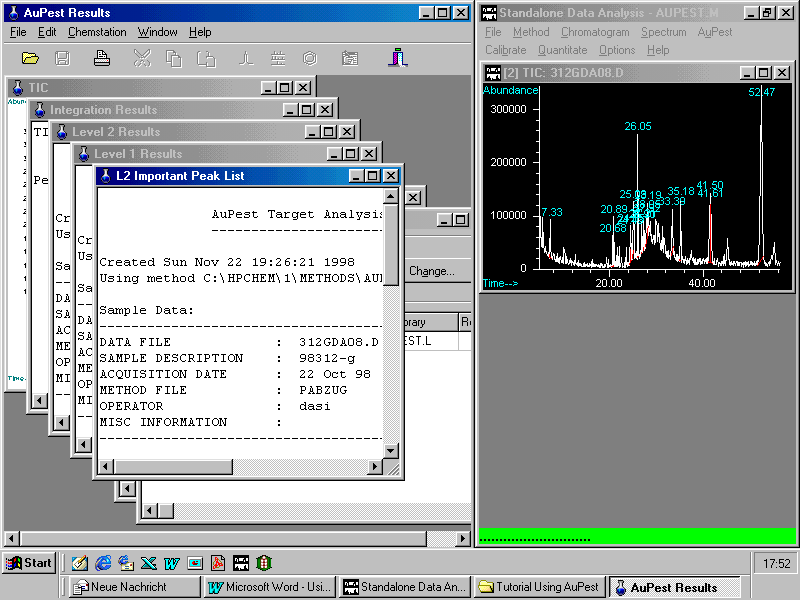
This will be demonstrated with a sample from the market: strawberries
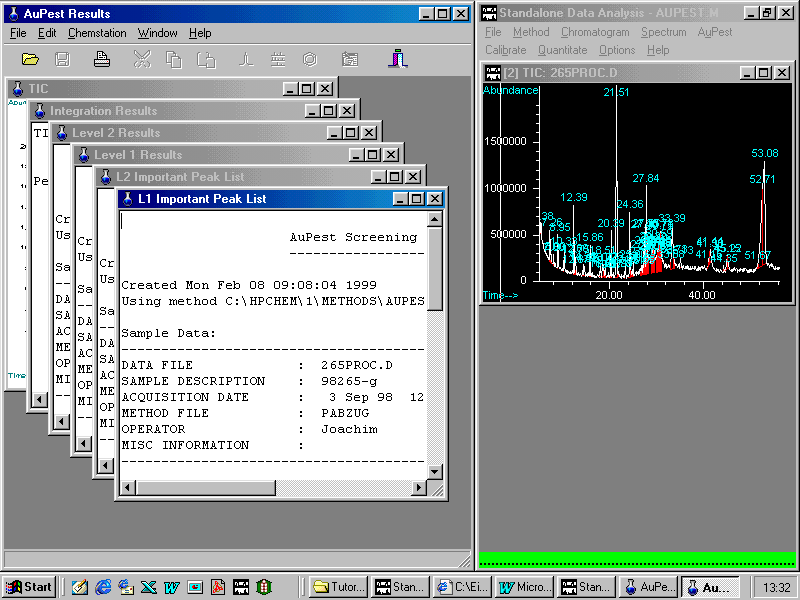
Clicking L1 Important Peak List
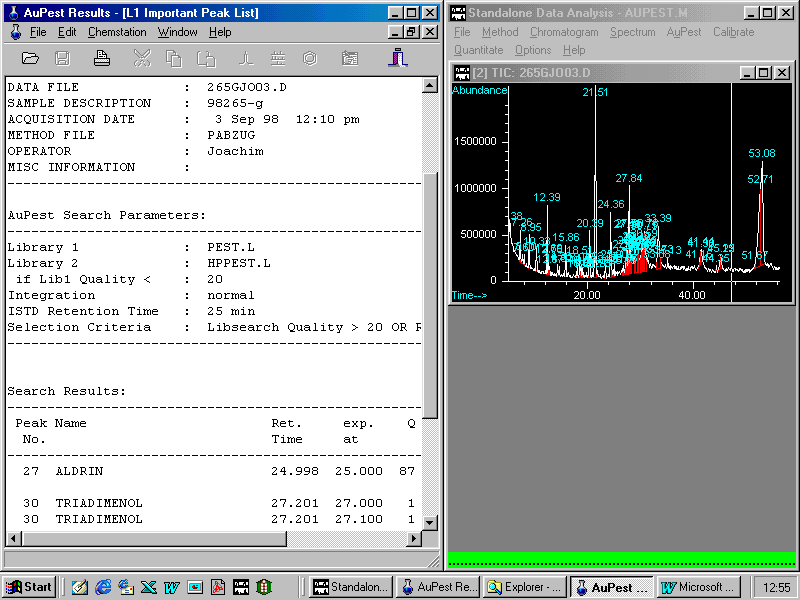
Note a technical problem: frequently, the report window does not maximize correctly. In this case, the window may be minimized and then again maximized.
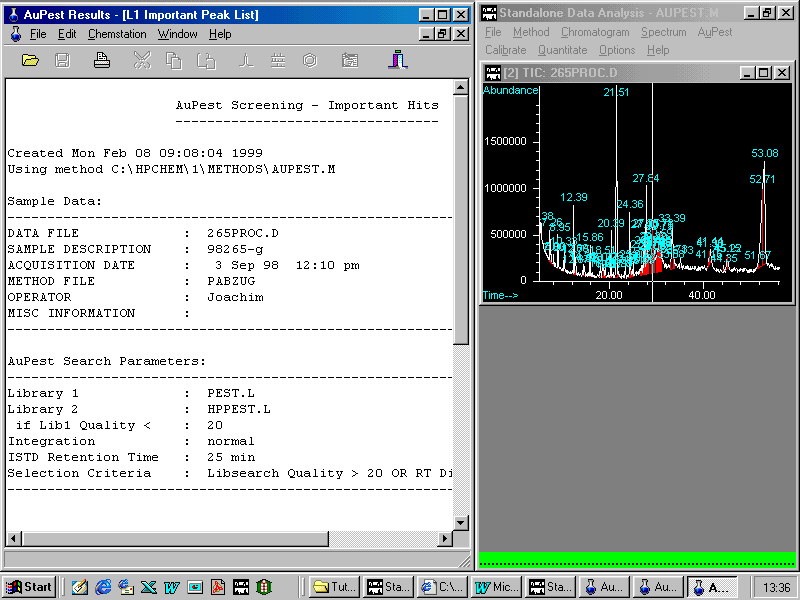
The left window displays the description of the sample including the AuPest search parameters using two libraries sequentially.
Scrolling in the Results List shows
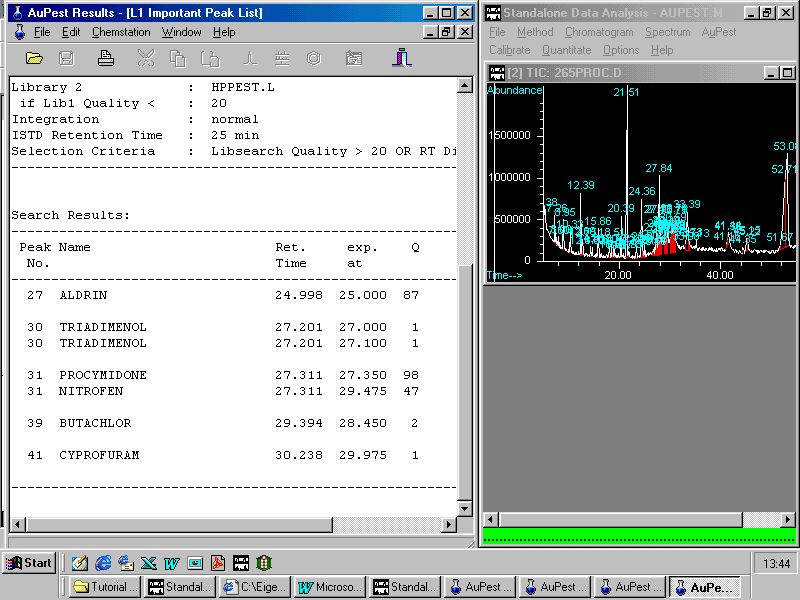
Two pesticides have been found: ALDRIN was used as Internal Standard and procymidone has to be checked although the quality is very good and almost no difference in the retention time can be found.
A right mouse click on procymidone opens a small pop-up menu enabling the analyst to zoom in the corresponding peak in the TIC chromatogram. Other options are to show the formula or to copy to summary report
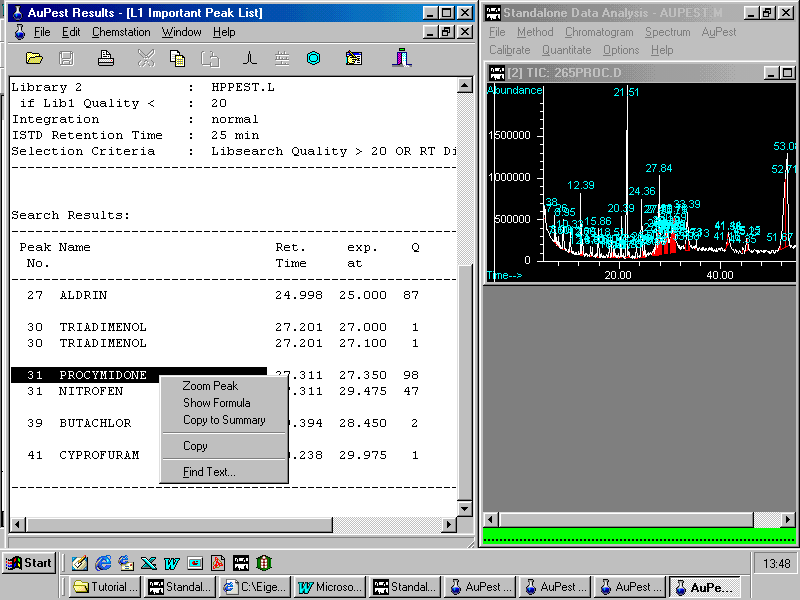
Zooming in a peak from the TIC chromatogram
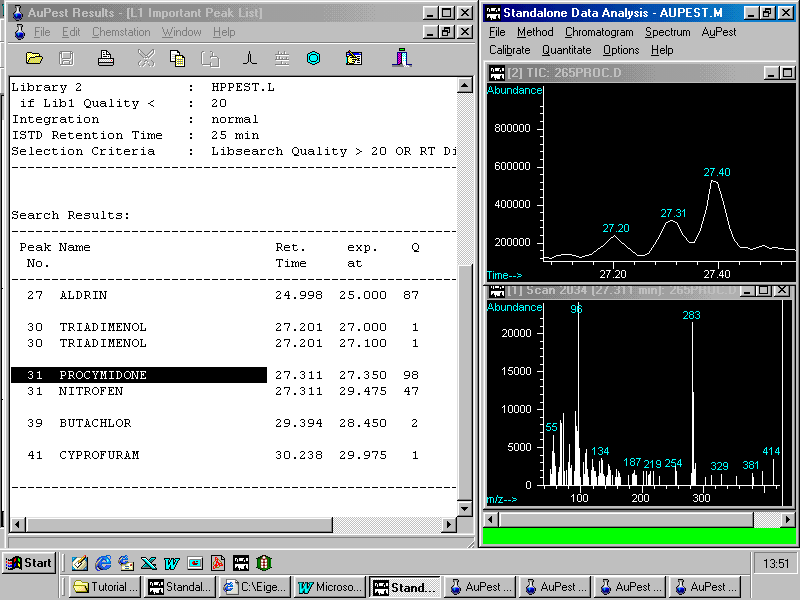
In the HP ChemStation Data Analysis window, three peaks are displayed with the procymidone peak at 27.31 min well separated from the other two. Simultaneously, with the peak of the selected target compound, the mass spectrum of the peak apex is shown below.
Manual background subtraction and library search can now be carried out as usual with the HP ChemStation software.
A double click on the mass spectrum activates library search in the pesticide library PEST.L . Two mass spectra from the unknown analyte and the best matching reference pesticide are displayed in two parallel windows. An additional small window bottom right indicates the name of the pesticide and also the found match quality.
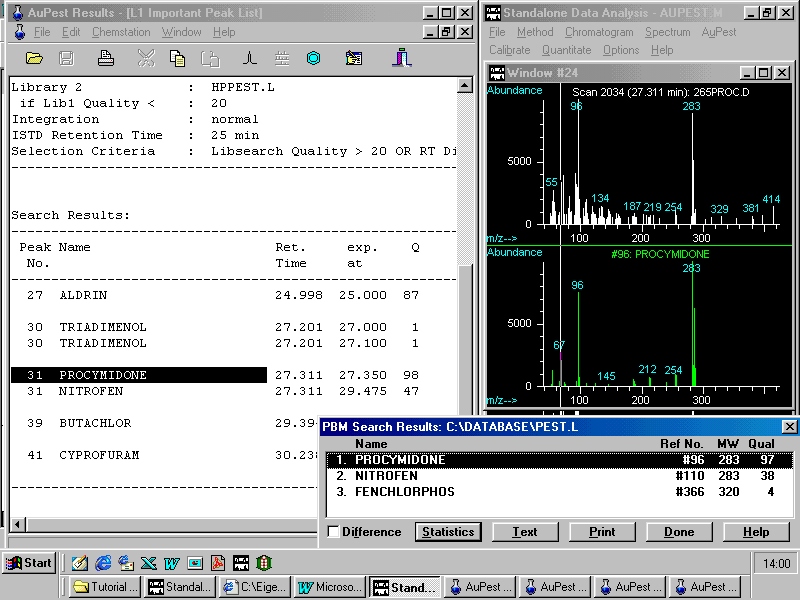
In this sample procymidone was completely separated from the matrix and background subtraction is expected to improve the match quality only a little although there is quite a lot of matrix fragments seen in the spectrum
Note that this mass spectrum represents about 1 ng of procymidone which is equivalent to a residue concentration of 0.1 ppm ( mg/kg ) in this strawberry sample. The MRL in strawberries is 5 ppm.
 Pointing again to procymidone
in the L1 Important Peak List, opening the
scroll down menu with a right mouse button click allows to copy
the result into the summary report together with comments or
remarks for other staff members.
Obviously, a summary report has not yet been created .
AuPest asks now for the names of the analyst doing the evaluation and also of the laboratory staff member who carried out the analysis (cleanup).
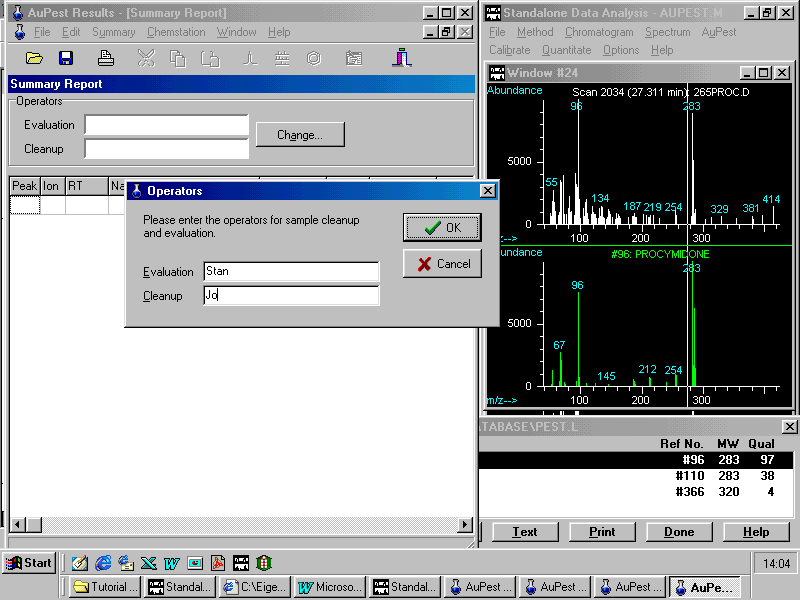
Note that the summary report is created when the analyst carries out the evaluation procedure for the first time on copying the first result into the report table. The summary report is a text file and the only report where information can be entered. All the other report tables created by AuPest from the raw data cannot be changed, they are read only documents.
After these two names have been entered, AuPest copies the data from the Results File to the Summary Report.
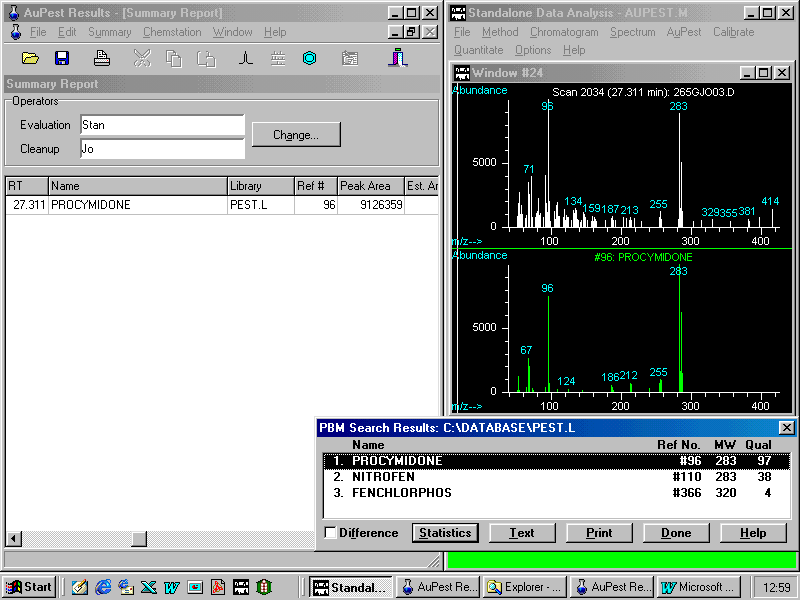
The peak area is reported also in a separate column. This allows the analyst to make an estimate of the residue concentration for quantitative analysis as described later.
In the particular example chosen here, there is another pesticide reported in the Level1 Important Peak List, namely triadimenol. The match quality, however, is very poor although the retention time is similar to that of triadimenol. Zooming in shows the same window as with procymidone but now the left peak is the target with a mass spectrum that looks uncharacteristic for any pesticide. A library search shows poor match quality which possibly may be improved by manual background subtraction.
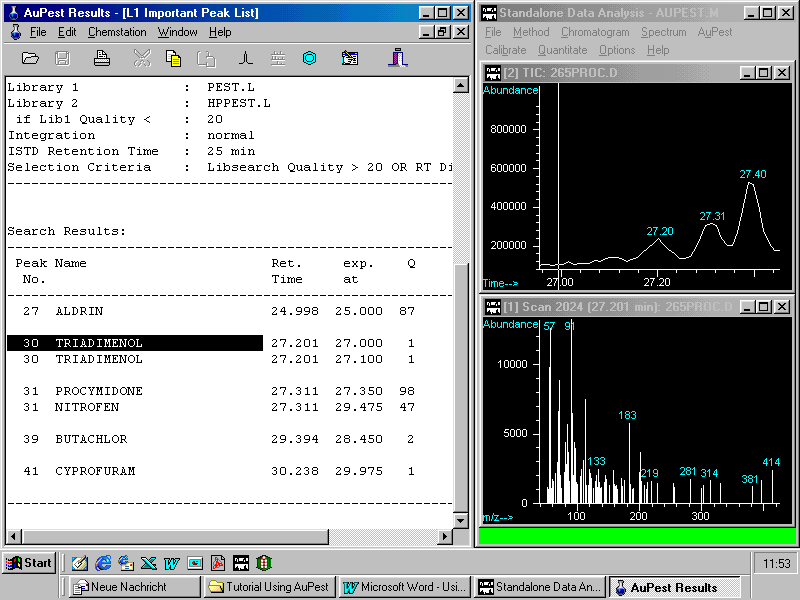
Manual background subtraction can easily be carried out in the Data Analysis window:
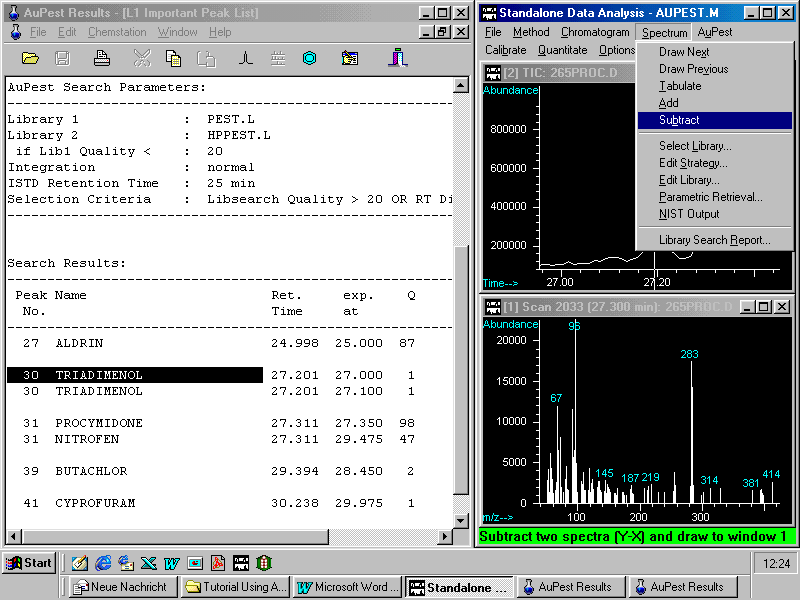
The best result of such an attempt is shown in the following figure:
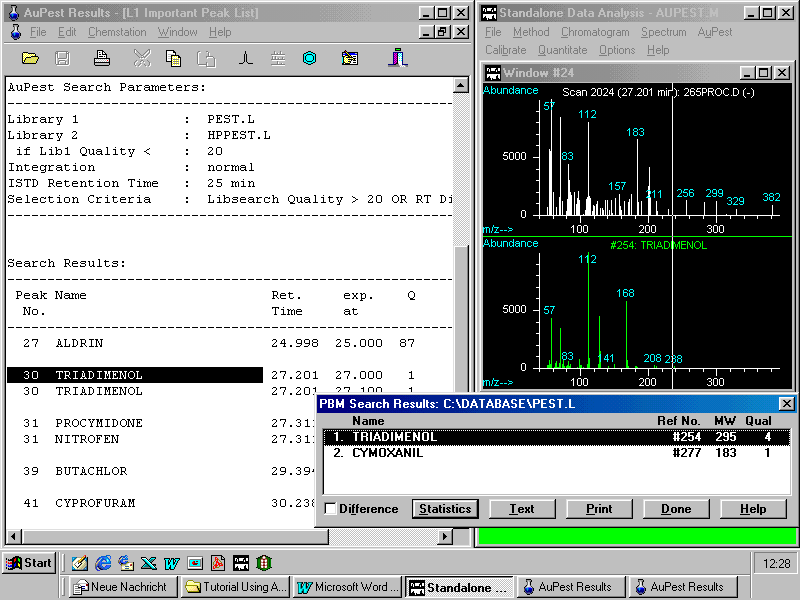
With this poor match quality and after visual inspection, triadimenol can definitely be ruled out.
Note that AuPest automatically carries out background subtraction. Our long term experience shows that manual background subtraction in most cases does not lead to considerably improved match results.
A look to the Level 1 Results List
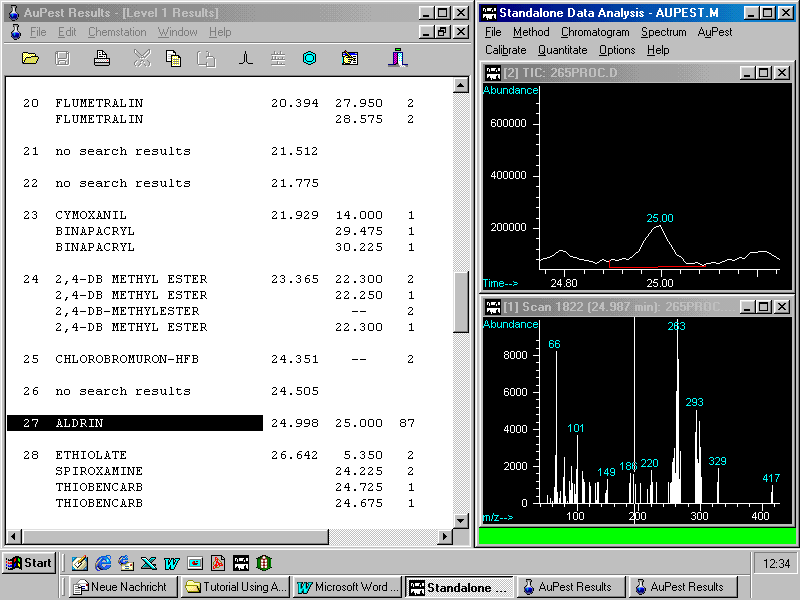
60 peaks have been identified by the integration procedure but with the exception of procymidone no other possible pesticide peak shows either good library search Quality Q or a retention time match.
In this sample, procymidone was the only pesticide found. The Level 2 Important Peak List also indicated procymidone as the single pesticide identified.
Two conclusions may be drawn at this point:
The inspection of the L2 Important Peak List is demonstrated with another sample: grapes
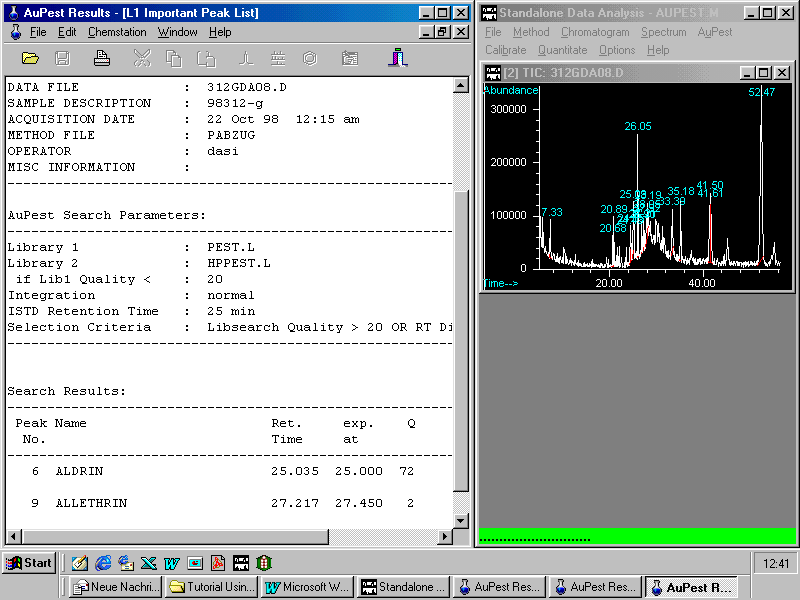
ALDRIN has been found as Internal Standard but also another pesticide, namely metalaxyl not recognized in AuPest Level 1.
Metalaxyl was indicated by matching the expected retention time within the time window set and also good hit quality in the AuPest Level 2 search. Therefore it was automatically selected to the AuPest Level 2 Important Peak List.
By pointing to metalaxyl and with a right mouse click, the pull down menu allows zooming in the corresponding time window with the ion chromatograms.
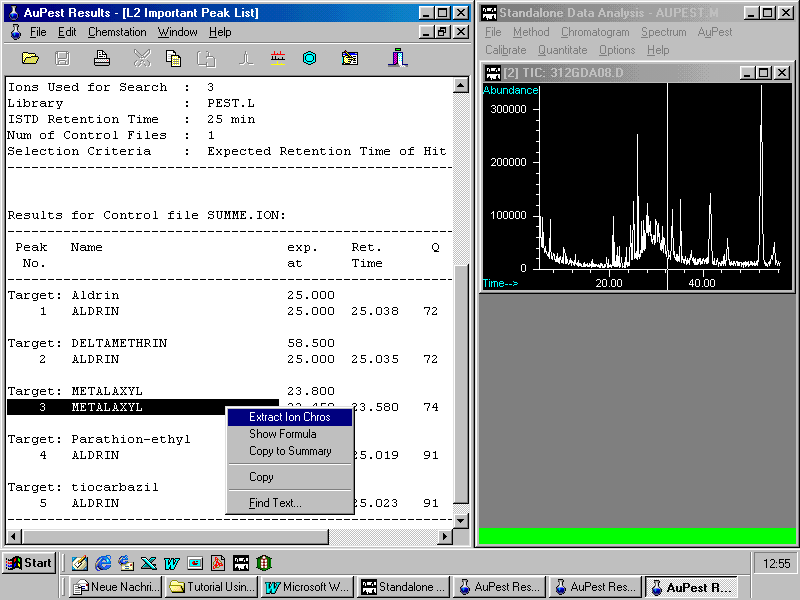
Note that the commands in the pop-up menu are also accessible with icons from the menu bar displayed above the corresponding results list ( here: L2 Important Peak List )
Selecting the command Extract Ion Chros displays on the right side the chromatograms of three indicative ions extracted from the TIC
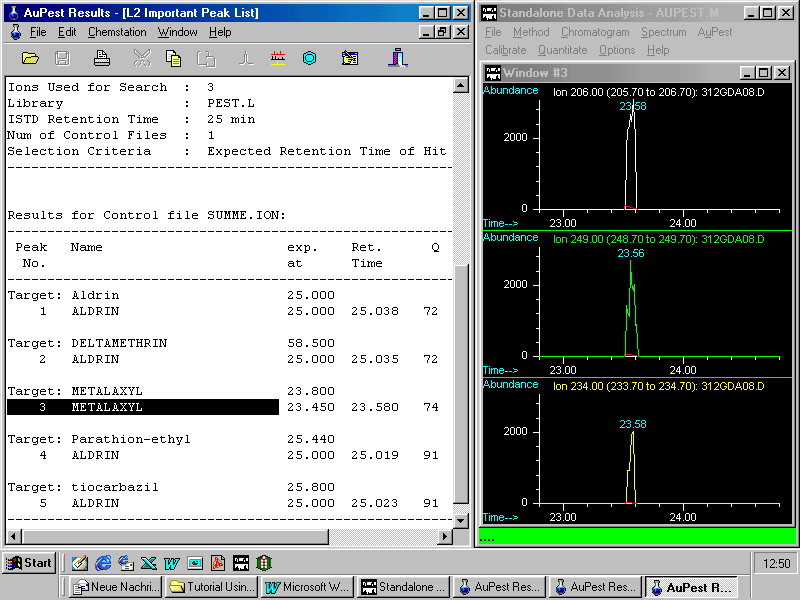
Note that ion chromatograms have automatically been reconstructed from the TIC chromatogram and applied to guide background subtraction and library search.
A double right mouse click on the peak apex in the ion chromatogram window shows first the mass spectrum and a further double right mouse click in this window activates the library search which confirms the result from the automated evaluation with AuPest Level 2
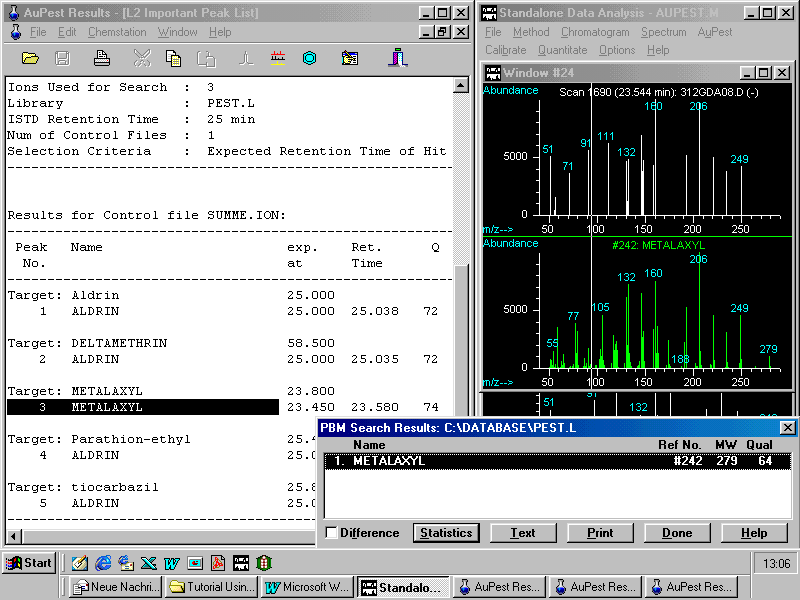
On the right side of the screen, a typical library search result as presented by the HP ChemStation is shown. It usually results in lower hit quality than that of the automated procedure. However, this type of check is necessary to bring the mass spectrum extracted from pesticide residue analysis together with that of the pesticide mass spectral library in the same format on the screen. The analyst is now able to check whether all indicative ions of the pesticide reference spectrum are there in the mass spectrum of the pesticide residue found in the sample.
Note: The concentration finally determined for metalaxyl in this grape sample was 0.02 ppm!
Pesticide residues confirmed in the sample may be copied to the summary list by pointing to the pesticide in the results table, with the pop-up menu being activated by a single right mouse click or with the icons in the Menu Bar on top of the AuPest Results window. This has already been demonstrated with the Level 1 Important Peak List.
Summary Report
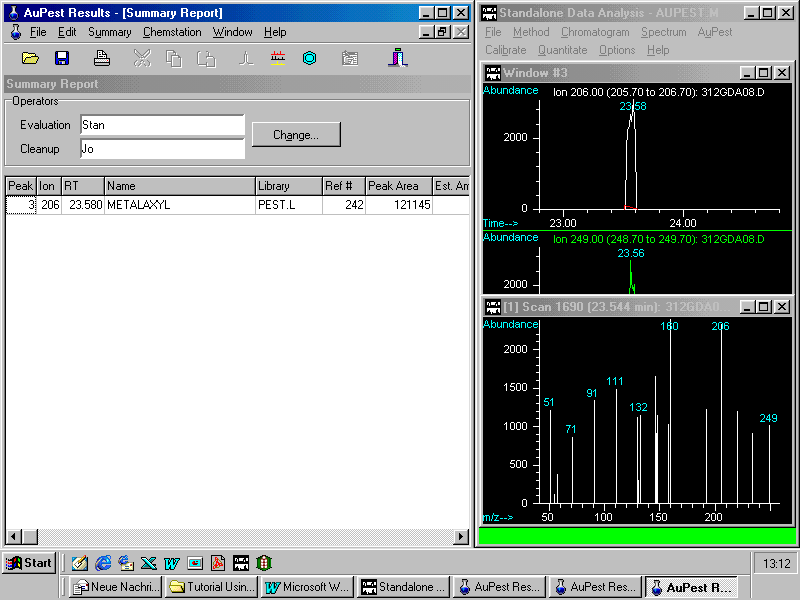
The Summary Report compiles all the results that can be worked out with AuPest as shown. It also includes the peak area of either a TIC chromatogram peak or a peak of a reconstructed ion chromatogram. The intention is to support the analyst in estimating the pesticide residue concentration in order to make the calibration standard at the correct concentration level. For instance, we run in our laboratory one or two calibration mixtures containing about 60 pesticides each with each sample sequence. Most current pesticides are in these mixtures to check for the performance of the chromatographic system and to get data for the detection sensitivity on that particular day.
These data or that of pesticides with similar detection response are usually taken for the calculation. The estimate, together with advice to the technician or other remarks about observations, can be entered in the comment cell. The comments are printed with the Summary Report.
Note: The Summary Report is intended only for intralaboratory use and for documentation in the laboratory.
The analysis report of the pesticide residue analysis of the food sample is produced without any support of AuPest in order to keep a clear separation between the analysis, identification of pesticide residues, quantification and the decision making of the final outcome of the results.
The final outcome of such a Summary Report looks like this:
AuPest Summary Report ---------------------
Created Mon Nov 09 14:58:36 1998
Sample Data:
--------------------------------------------------------------------DATA FILE : 312GDA08.D
SAMPLE DESCRIPTION : 98312-g
ACQUISITION DATE : 22 Oct 98 12:15 am
METHOD FILE : PABZUG
OPERATOR : dasi
MISC INFORMATION :
--------------------------------------------------------------------
Operators:
--------------------------------------------------------------------
Cleanup : Jo
Evaluation : Stan
--------------------------------------------------------------------
Original Report Data:
--------------------------------------------------------------------
Target Analysis : C:\HPCHEM\1\METHODS\AUPEST.M
created on : Sun Nov 22 19:26:21 1998
--------------------------------------------------------------------
Results:
--------------------------------------------------------------------
Peak Ion Ret. Name Peak Area Est. Amount
No. Time
--------------------------------------------------------------------
3 206 23.580 METALAXYL 121145
Comment: pesticide residue
is confirmed but at very low concentration
compared to the MRL of 2 ppm.
Quantitation with 0.1 ppm added
to a grape extract with SIM
(Courier New 10)
In the column Ion, the indicative ion is displayed (here 206) showing that the residue metalaxyl was detected with AuPest Level 2 , otherwise TIC is reported in this column.
Note: The results reported here for real market samples have been obtained by automatical evaluation of one single full scan run of a grape sample with minimum cleanup ( extraction with acetone and online partitioning into cyclohexane + ethyl acetate ) applying a HP GC-MSD instrument built in 1986!
A last example is presented with a sample of clementines
The final summary report contains two pesticide residues and comments prepared by one analyst in the laboratory and is subject to be checked by another analyst or the supervisor.
At first he looks on the print out of the Summary Report AuPest Summary Report
---------------------
Created Mon Jan 11 12:38:50 1999
Sample Data:
---------------------------------------------------------------------------
DATA FILE : 003GDA04.D
SAMPLE DESCRIPTION : 99003-g
ACQUISITION DATE : 11 Jan 99 10:42 am
METHOD FILE : AUPEST
OPERATOR : dasi
MISC INFORMATION :
---------------------------------------------------------------------------
Operators:
---------------------------------------------------------------------------
Cleanup : mok
Evaluation : dasi
---------------------------------------------------------------------------
Original Report Data:
---------------------------------------------------------------------------
Screening Analysis : C:\HPCHEM\1\METHODS\AUPEST.M
created on : Mon Jan 11 11:38:57 1999
Target Analysis : C:\HPCHEM\1\METHODS\AUPEST.M
created on : Mon Jan 11 11:39:17 1999
---------------------------------------------------------------------------
Results:
---------------------------------------------------------------------------
Peak Ion Ret. Name Peak Area Est. Amount
No. Time
---------------------------------------------------------------------------
68 TIC 25.171 ALDRIN 8876422
8 261 25.181 ALDRIN 209905
71 TIC 25.467 CHLORPYRIFOS 11122080
Comment: positive, residue
conc. similar to ALDRIN: about 0.1 ppm,
quantitation with SIM, spike
clementine extract with 0.1 ppm
22 314 25.484 CHLORPYRIFOS
276606
Comment: confirmed
47 116 29.234 KRESOXIM-METHYL 0
Comment: possibly present
– please check carefully
quantitation with SIM, spike
with 0.05 ppm (MRL = 0.05 ppm)
When opening an AuPest Results file already evaluated an additional page appears in the foreground, the Summary Report which is created during an evaluation session storing and documenting the opinion of the analyst as fixed in the Summary Report header.
It is important to retrace how the final outcome has been obtained. This is easily achieved by tracing back to the origin. All data in the Summary Report have been copied from one of the Important Peak Lists and these automatically selected information have been drawn from the L1 or L2 Results.
Therefore, a "thread of Ariadne" leads the analyst back or out of the labyrinth of peaks and data.
The supervisor checks the results by tracing back from the Summary Report as demonstrated below.
Loading the sample data file with AuPest Results
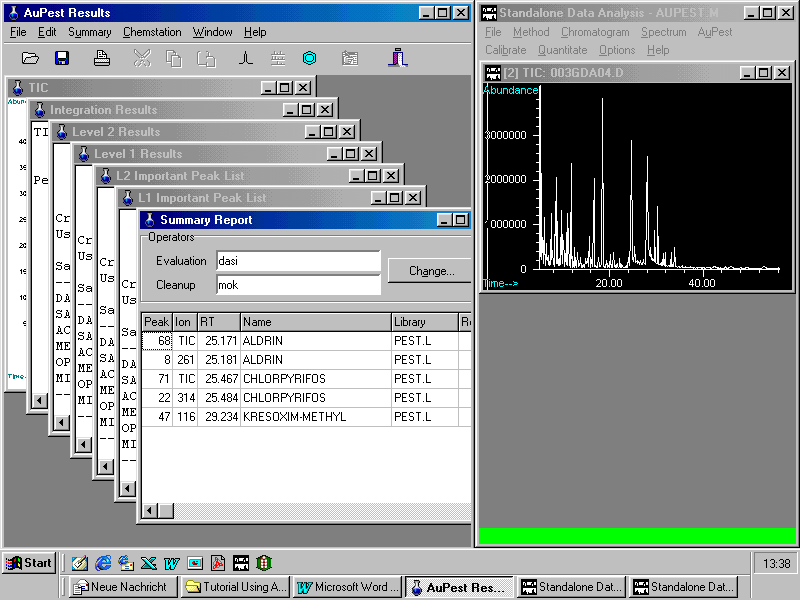
Opening the Summary Report which reports the presence of two pesticide residues and comments (extract as displayed in the AuPest Results window)
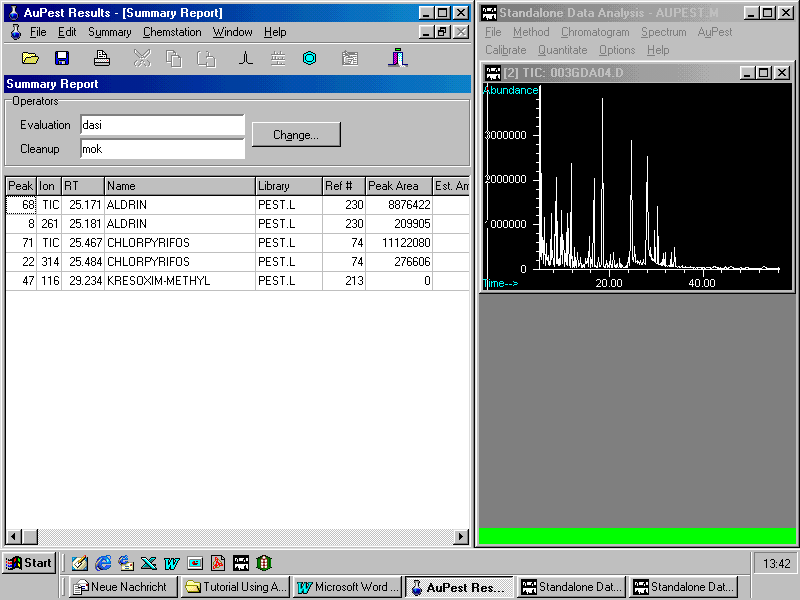
The supervisor may point to one of the reported pesticides and zoom in the peak and mass spectrum of the target compound.
In this case, the peak of chlorpyrifos is zoomed in from the L1 Results Important Peak List which is linked to the Level 1 Results . This is indicated as peak number 71 in the TIC chromatogram
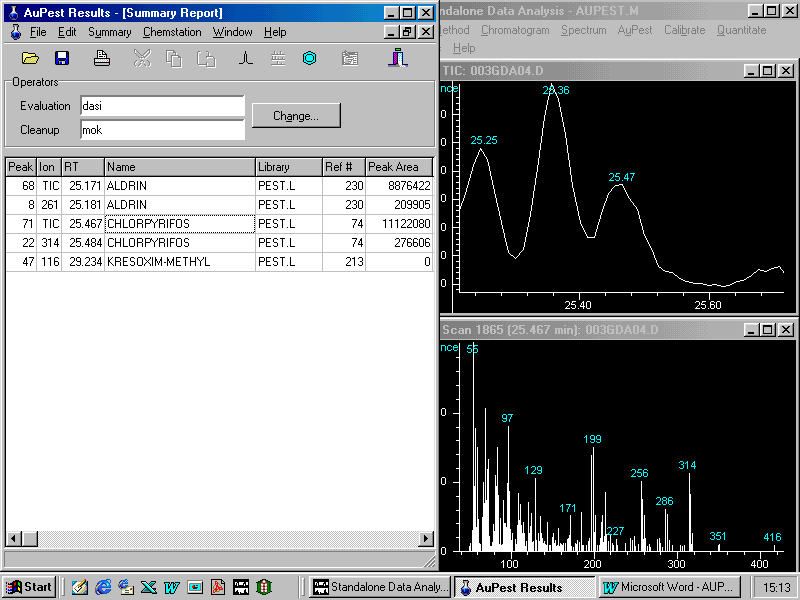
Manual background subtraction and library search provides the following display on the monitor
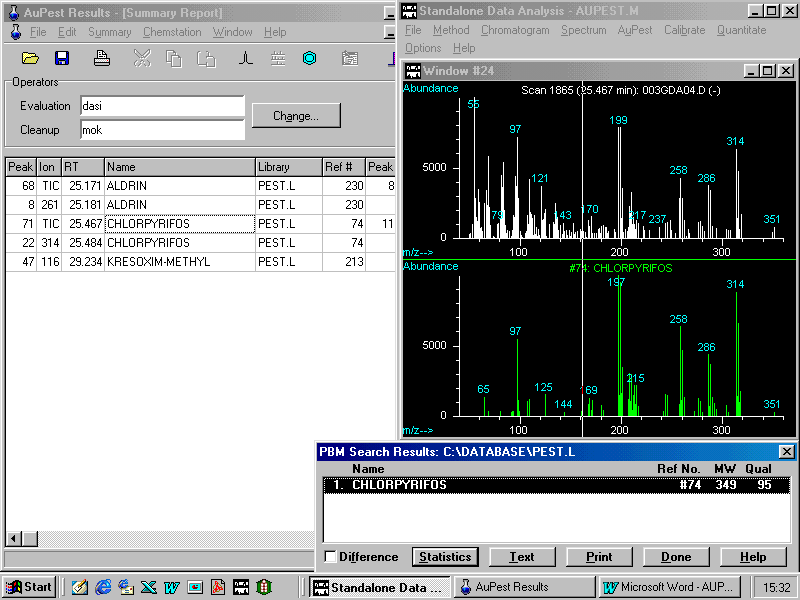
There can be no doubt that chlorpyrifos is present in the sample at a considerable residue concentration level because it could be easily detected from the TIC.
The quantitative analysis resulted in 0.1 ppm chlorpyrifos
Level 2 analysis confirms this result.
The next step is checking for kresoxim-methyl, a relatively new fungicide, which was found only in Level 2. Zooming in displays three indicative ion chromatograms with a peak at the expected retention time
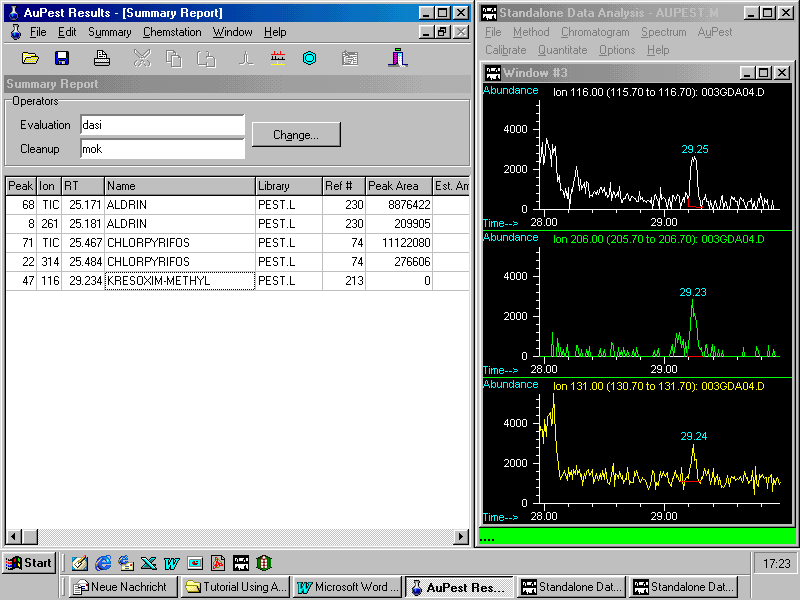
A library search after manual background subtraction results in good match quality although many matrix ions are seen in the analyte spectrum. The display of the mass spectra of the "unknown" together with that of the matching reference pesticide in the same size makes is easy to check if the indicative ions from the reference pesticide can be observed in the "unknown".
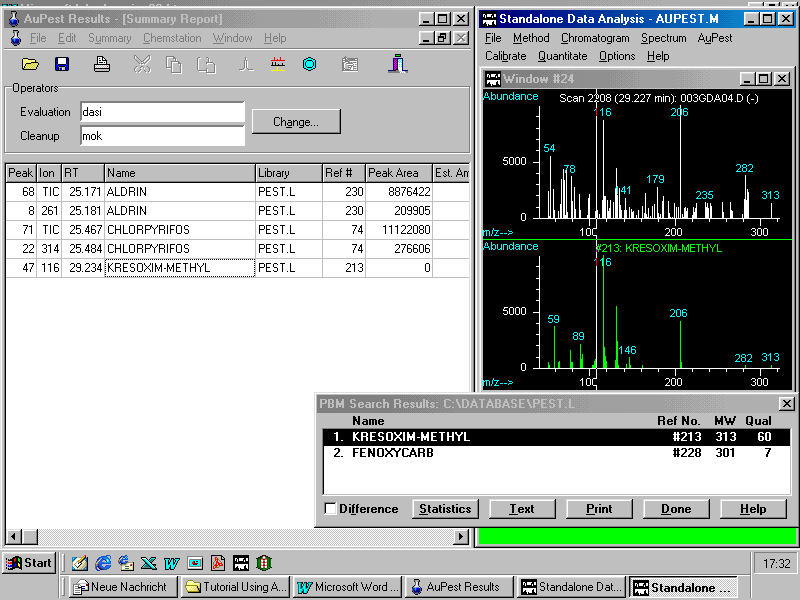
The visual check is supported by the library search using the PBM algorithm as demonstrated in the results window bottom right. Kresoxim-methyl is obviously present in the sample at low residue concentration level.
Quantitative determination with SIM resulted in 0.12 ppm (!) demonstrating that the limit of detection in GC/MS depends on chromatography and mass spectral fragmentation pattern.
In this particular sample it may be interesting to find out what the reason for the problems with the detectability at low concentration levels was.
Visual inspection of Level 1 Results shows only one peak in the retention time window of kresoxim-methyl which obviously is no pesticide.
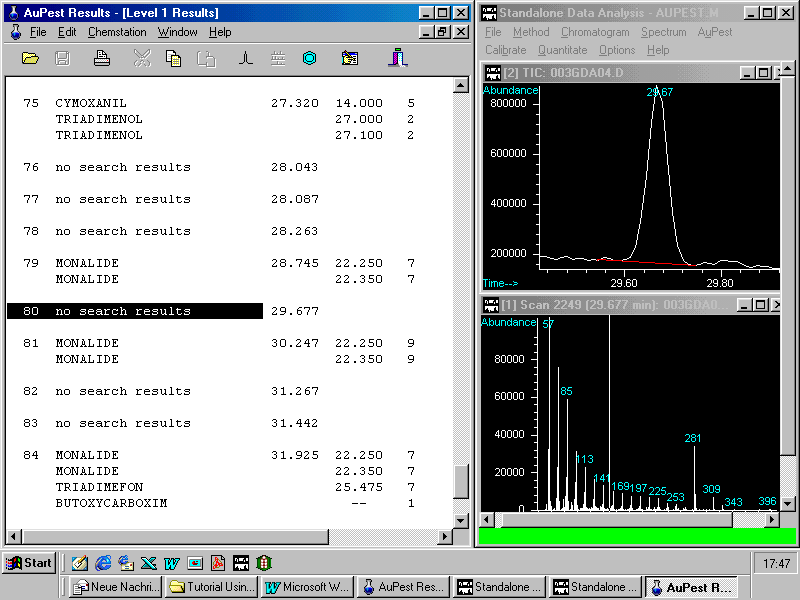
At the retention time of kresoxim-methyl at 29.24 min there is no peak traceable after zooming in this time window of the TIC chromatogram. With 87 peaks integrated in the TIC chromatogram it is very unlikely that any analyst would have investigated this part of the chromatogram in order to check for kresoxim-methyl.
Zooming in a larger window manually demonstrates that no peak arises at 29.24 min above the background baseline of the TIC chromatogram
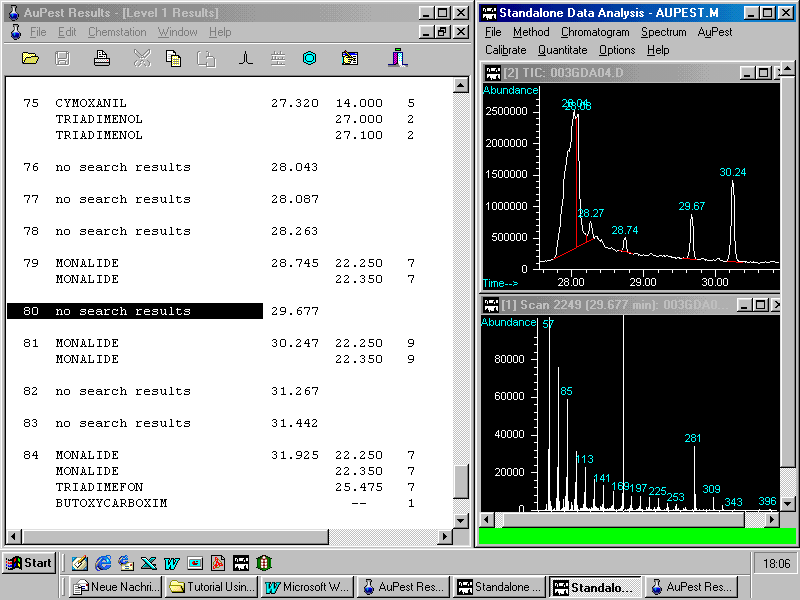
This example may demonstrate the usefulness of AuPest Level 2 in tracing hidden pesticide residues in a food sample.
The next figure shows in the right top window three ion chromatograms reconstructed from the TIC manually with the same indicative three ions m/z 116, 206 and 131 as used in the Level 2 search algorithm with the control file aupest.ion.
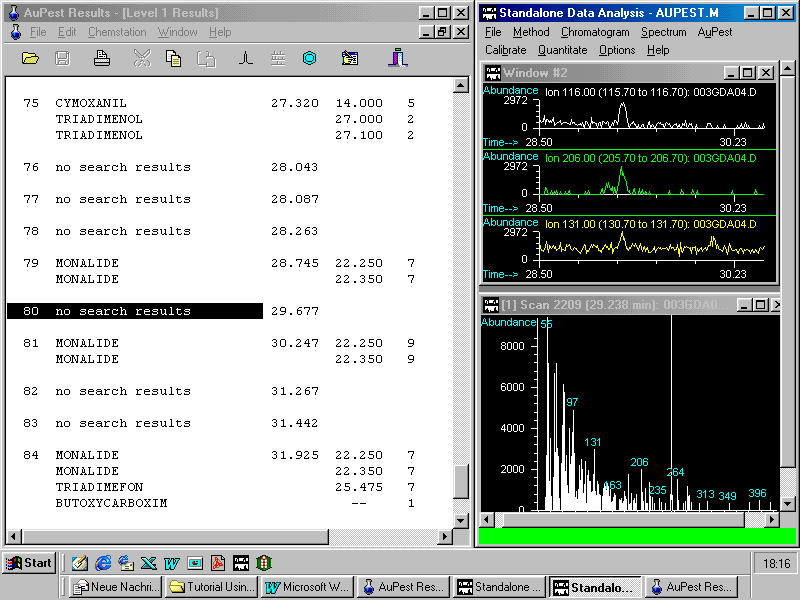
A small peak can be observed at the correct retention time. After doing background subtraction and library search kresoxim-methyl is found with low match quality as demonstrated in the next figure.
Library search after manual background subtraction
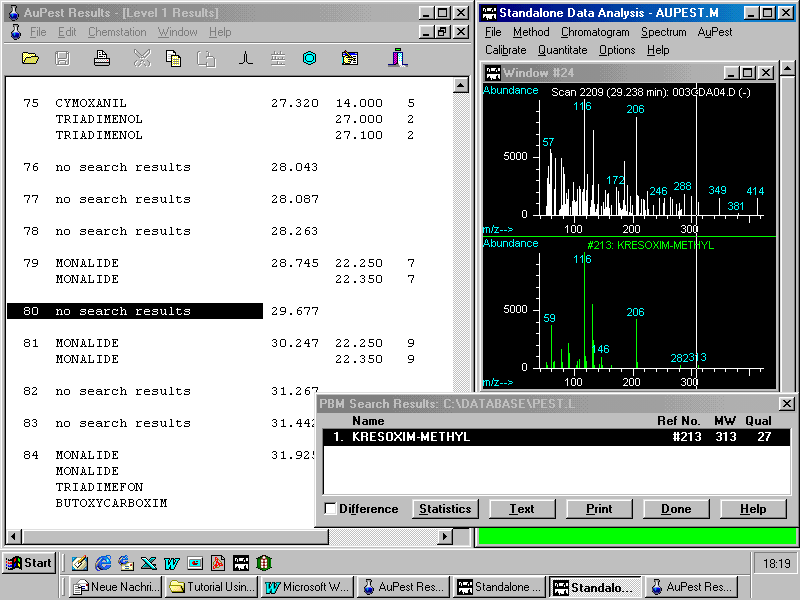
The presence of kresoxim-methyl is manually confirmed: the ions indicative in the reference mass spectrum are to be observed in the "unknown" which together with the matching retention time is an important fact for its identity.
This example described in some detail proves how a valuable tool AuPest can be in the hand of analysts dealing with pesticide residue analysis in food samples.
Note: final confirmation is performed with SIM which is used for the quantitative analysis with a spiked sample.
Another feature of AuPest is the display of the structural formula of an identified pesticide by pointing to the name and activating the pop-up menu or the icon in the menu bar. This may be especially of interest with new active ingredients.
using34
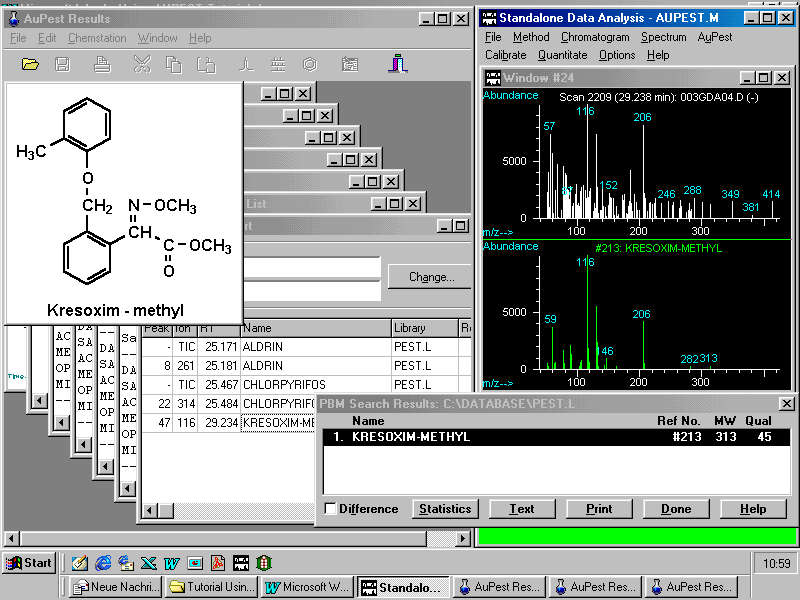
The next page demonstrates possibilities for handling the data compiled in the Summary Report.
Handling large Summary Reports shown with a calibration mixture of 60 pesticides
AuPest Screening - Important Hits
---------------------------------
Created Wed Dec 09 09:39:42 1998
Using method C:\HPCHEM\1\METHODS\AUPEST.M
Sample Data:
---------------------------------------------------------------------------
DATA FILE : 70ERA01.D
SAMPLE DESCRIPTION : Calibration Mix A – 60 PesticidesACQUISITION DATE : 10 Sep 98 1:04 pm
METHOD FILE : PABZUG
OPERATOR : Joachim
MISC INFORMATION :
--------------------------------------------------------------------------
AuPest Search Parameters:
---------------------------------------------------------------------------
Library 1 : PEST.L
Integration : normal
ISTD Retention Time : 25 min
Selection Criteria : Libsearch Quality > 20 OR RT Difference < 1 min
---------------------------------------------------------------------------
Search Results:
---------------------------------------------------------------------------
Peak Name Ret. exp. Q Ref Lib Peak Area
No. Time at
---------------------------------------------------------------------------
7 METHAMIDOPHOS 5.611 5.775 97 45 1 9472398
8 DICHLORVOS 5.841 5.975 91 88 1 19173505
45 MEVINPHOS 9.097 9.275 94 81 1 27263894
46 ACEPHATE 9.305 9.800 87 168 1 6730988
49 PROPHAM 9.755 9.925 91 82 1 19198362
57 METHACRIFOS 10.906 11.100 91 89 1 26857259
79 TEPP 12.703 12.975 64 24 1 2021759
82 HEPTENOPHOS 13.010 13.200 96 90 1 17348288
106 CHLORPROPHAM 15.104 15.250 93 83 1 14812859
129 HEXACHLOROBENZENE 17.307 17.425 99 62 1 41053366
130 DICLORAN 17.538 17.475 99 175 1 16262157
131 DIMETHOATE 17.603 17.775 98 176 1 12350679
140 GAMMA-HCH 18.491 18.950 96 63 1 21974016
141 PENTACHLOROPHENOL 18.601 18.600 97 180 1 10710660
142 BETA-HCH 18.798 19.750 99 479 1 27860285
143 QUINTOZENE 19.116 19.250 97 72 1 24887143
146 PYRIMETHANIL 19.609 19.750 86 322 1 26109292
147 DIAZINON 19.829 19.950 83 91 1 52742921
152 CHLOROTHALONIL 20.618 20.725 98 288 1 28495321
159 PIRIMICARB 21.451 21.550 97 92 1 29304531
165 PHOSPHAMIDON 22.229 22.300 91 182 1 16162430
169 CHLORPYRIFOS-METHYL 22.788 23.000 86 268 1 68903721
170 TOLCLOFOS-METHYL 23.095 23.175 83 66 1 44578654
172 METALAXYL 23.578 23.450 96 242 1 36356566
180 FENITROTHION 24.356 24.375 99 243 1 18244978
181 PIRIMIPHOS-METHYL 24.444 24.475 94 93 1 40065042
183 DICHLOFLUANID 24.740 24.875 96 7 1 22285407
184 MALATHION 24.871 24.900 58 84 1 23480856
185 ALDRIN 25.025 25.000 90 230 1 34535840
186 FENTHION 25.277 25.300 97 77 1 26105967
187 CHLORPYRIFOS 25.364 25.400 99 74 1 58930554
188 4,4'-DICHLOROBENZOPHENONE 25.485 25.500 98 172 1 17062984
190 CHLORTHION 25.803 25.750 64 171 1 15574568
194 PIRIMIPHOS-ETHYL 26.263 26.300 96 94 1 56413617
199 CHLOZOLINATE 26.855 26.850 93 75 1 45971080
200 MECARBAM 27.042 27.050 99 95 1 31522714
201 QUINALPHOS 27.118 27.100 99 185 1 16308887
202 FOLPET 27.283 27.300 99 86 1 8827841
203 PROCYMIDONE 27.349 27.350 94 96 1 22788443
205 METHIDATHION 27.623 27.350 91 97 1 13360104
208 ALPHA-ENDOSULFAN 28.028 28.000 91 68 1 29589405
213 IMAZALIL 28.543 28.475 97 186 1 8486241
214 DIELDRIN 28.872 28.875 95 61 1 28426091
215 O,P-DDD 29.048 30.475 40 360 1 1344373
216 BUPIRIMATE 29.146 29.025 98 195 1 25092725
222 CHLOROBENZYLATE 29.826 29.775 49 87 1 51813514
223 BETA-ENDOSULFAN 29.957 29.925 93 69 1 26224595
224 P,P-DDD 30.188 30.175 50 76 1 31690418
225 O,P-DDT 30.319 30.225 97 173 1 69554866
239 P,P'-DDT 31.580 31.500 83 174 1 55667450
244 DICOFOL 32.062 34.000 59 207 1 6789155
289 PHOSALONE 35.822 35.725 99 321 1 12159879
290 AZINPHOS-METHYL 35.943 34.725 50 245 1 2677225
310 FENARIMOL 37.609 37.325 87 204 1 11163782
311 PYRAZOPHOS 37.817 37.550 97 209 1 14909156
312 AZINPHOS-ETHYL 38.124 37.500 86 246 1 7209159
322 BITERTANOL 39.560 39.800 56 265 1 3549235
Comment: 57 pesticides/including isomers found in Level 1 Important Peak List
239 TOLYLFLUANID 26.888 26.900 99 79 1 4843933
Comment: Tolylfluanid forms
a critical pair with chlozolinate, peaks are not
separated – therefore only
found in Level 2
148 ETHION 30.275 30.222 60 80 1 2221297
Comment: Ethion forms a
critical pair with o,p-DDT, there is only one
symmetrical peak seen in TIC -
therefore only found in Level 2
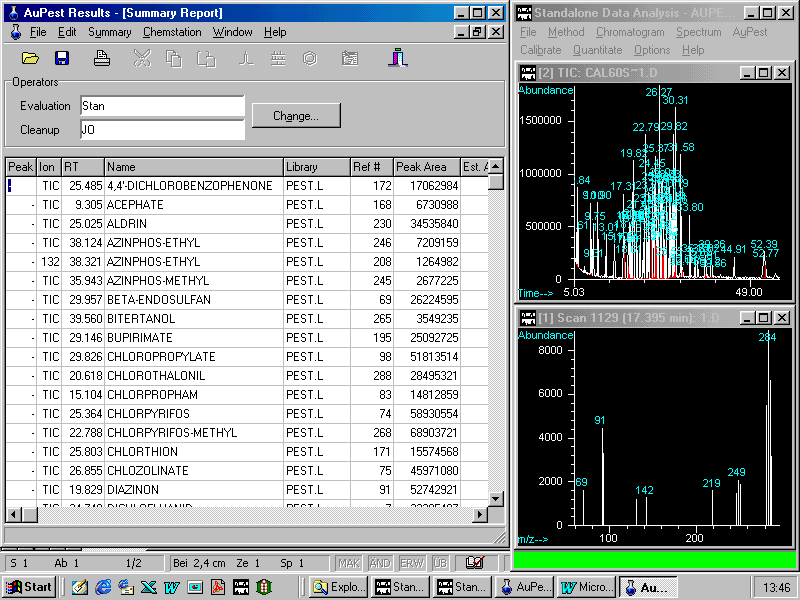
It is possible to sort by retention time or name, Level 1 Results ( TIC peaks ) and Level 2 Results. This can be helpful with chromatograms containing many positive results such as in calibration mixtures of 60 pesticides and more. Furthermore, it is possible to edit the summary list by removing rows or columns in the table.
In the following pages it should be generally demonstrated how AuPest helps to deal with complex samples such as standard test mixtures.
Summary Reports may be sorted according to the means shown in the pull down menu Summary > Sort by:
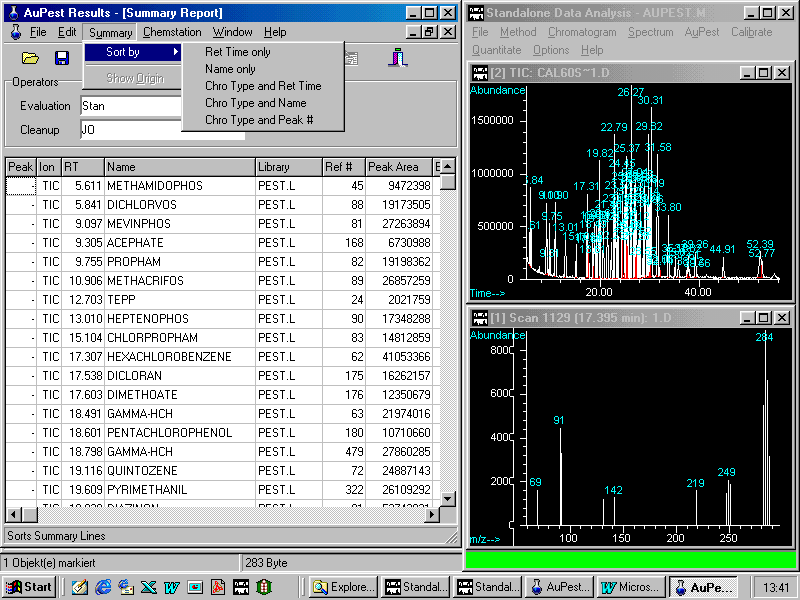
Sorting by names is frequently used in order to check if all the pesticides in the calibration test mixture have been identified.
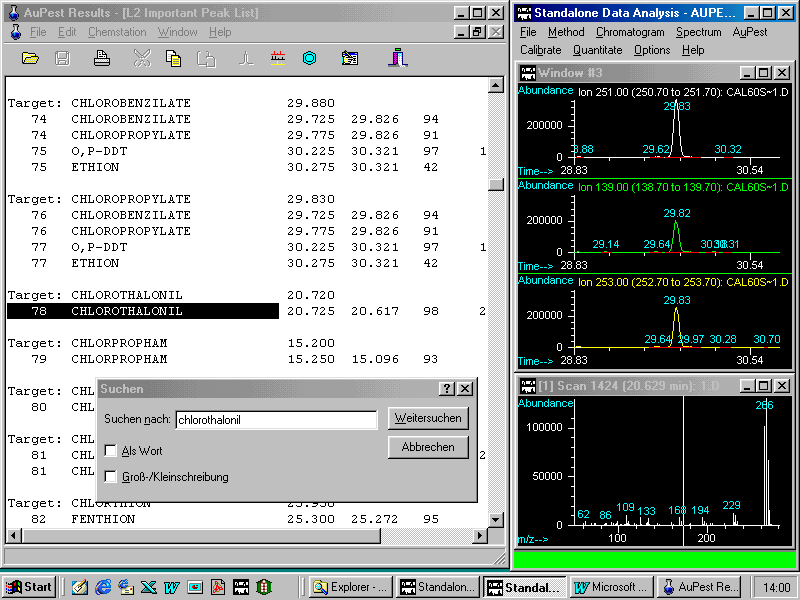
Another useful tool is the command Edit > Find allowing the user to find a pesticide in a Summary Report or more importantly in the complex Level 2 Results as shown in the next figure.
Finally, it is important to understand why the two pesticides hidden in critical pairs could be identified by the AuPest Level 2 algorithm but not by the AuPest Level 1 algorithm.
The critical pair of chlozolinate and tolylfluanid is shown in the next figure:
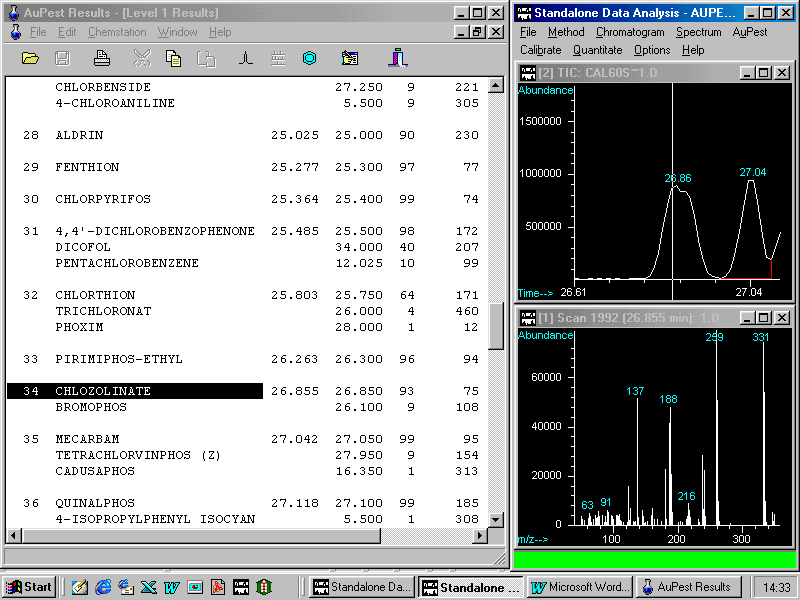
The critical pair at 26.86 min can visually be easily identified as being two compounds, however the integration algorithm found only one single peak with a shoulder.
It is obvious that the shoulder represents tolylfluanid which can be identified by background subtraction of the later eluting part of the peak.
This is a good example of the problem which arises from critical pairs for the AuPest Level 1 algorithm (and all other known procedures relying on peak integration) and how this problem is overcome with the AuPest Level 2 algorithm.
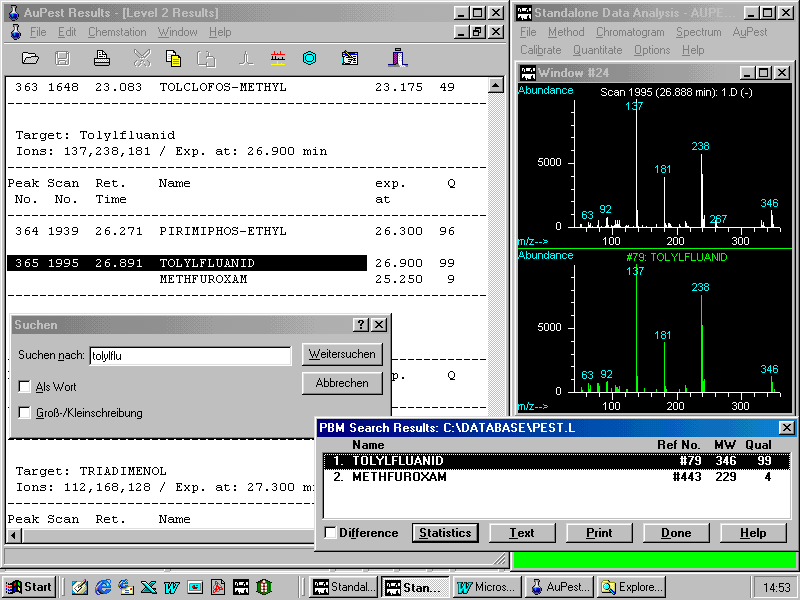
The next figure shows the check for the presence of tolylfluanid in the AuPest Level 2 Results using the helpful commands already described:
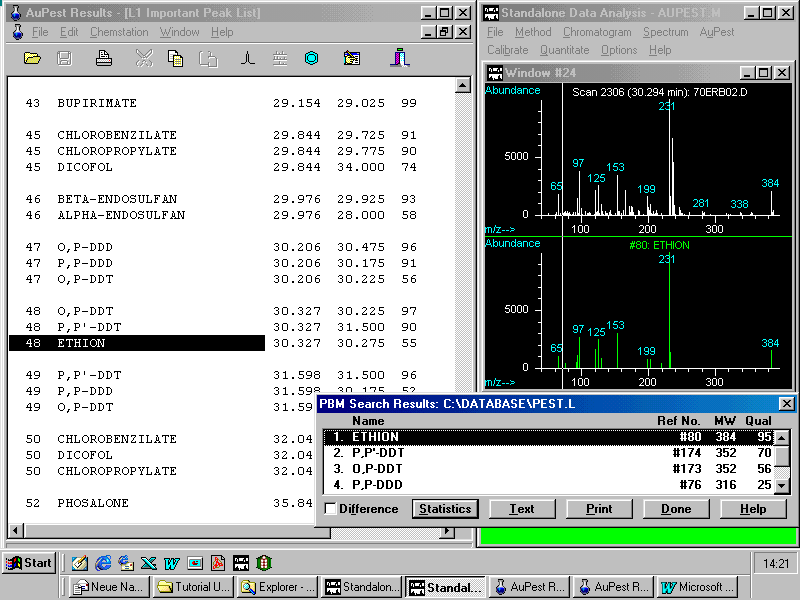
The other critical pair of ethion and o,p-DDT exhibits in the TIC chromatogram a single symmetrical peak without any apparent shoulder or visible peak broadening!
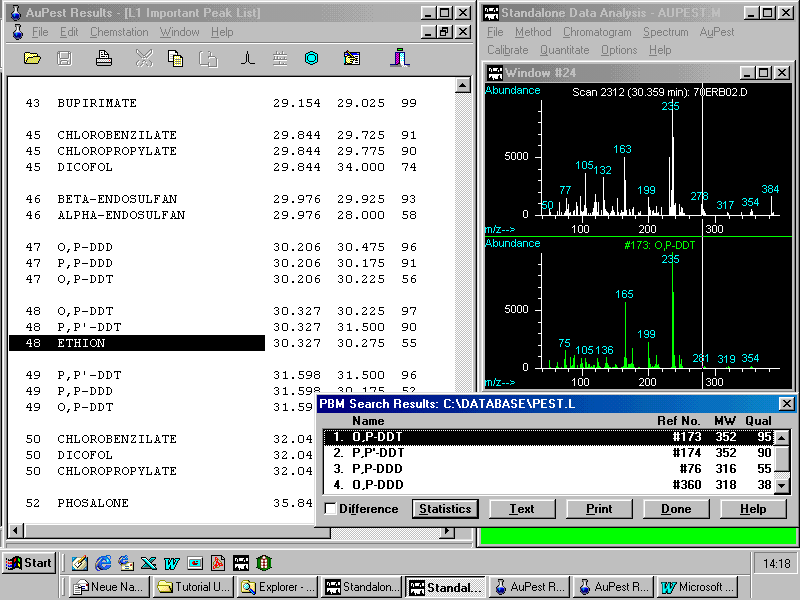
Although ethion is also indicated, the match quality of the o,p-DDT spectrum is as high as 97!
By doing manual background subtraction at the increasing slope of the peak a mass spectrum can be obtained that matches exactly that of the ethion reference spectrum with a quality of 95!
A frequent problem with the display of the various windows is demonstrated and explained how to cope with it.
On selecting a Results List, sometimes a disturbed or an empty window appears such as shown in this figure
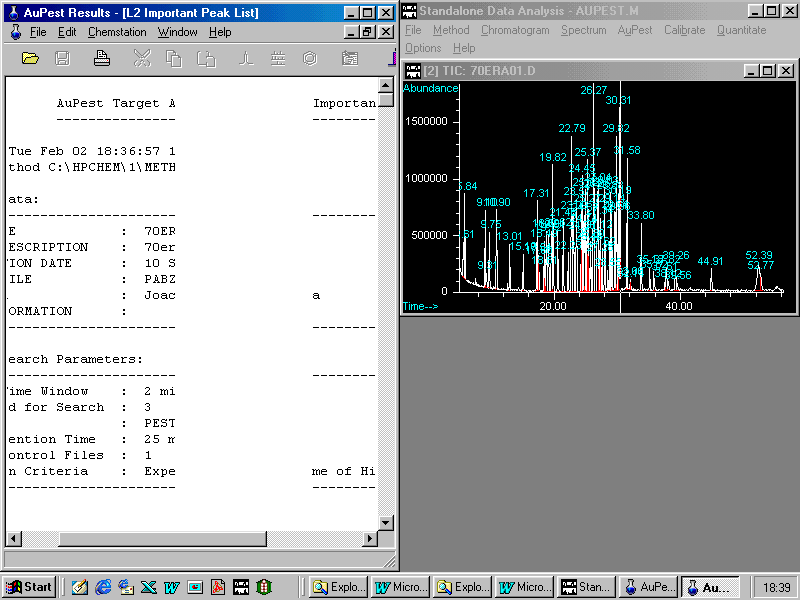
The solution: minimize the window and maximize it again and the window is restored in the usual form as shown in the next figure.
Note: you can change the size of the various windows by dragging the frames just as in other applications under WINDOWS. If you run into trouble the minimize / maximize procedure may be helpful or the command Reset Main Window which you find in the AuPest Results menu bar in the pull down menu under Window. This command always divides the monitor screen in two parts with the AuPest Results window on the left.
Working practice with the
various commands will make you quickly familiar with AuPest.